wireshark Package Description
Wireshark is the world’s foremost network protocol analyzer. It lets you see what’s happening on your network at a microscopic level. It is the de facto (and often de jure) standard across many industries and educational institutions. Wireshark development thrives thanks to the contributions of networking experts across the globe. It is the continuation of a project that started in 1998.
Wireshark has a rich feature set which includes the following:
- Deep inspection of hundreds of protocols, with more being added all the time
- Live capture and offline analysis
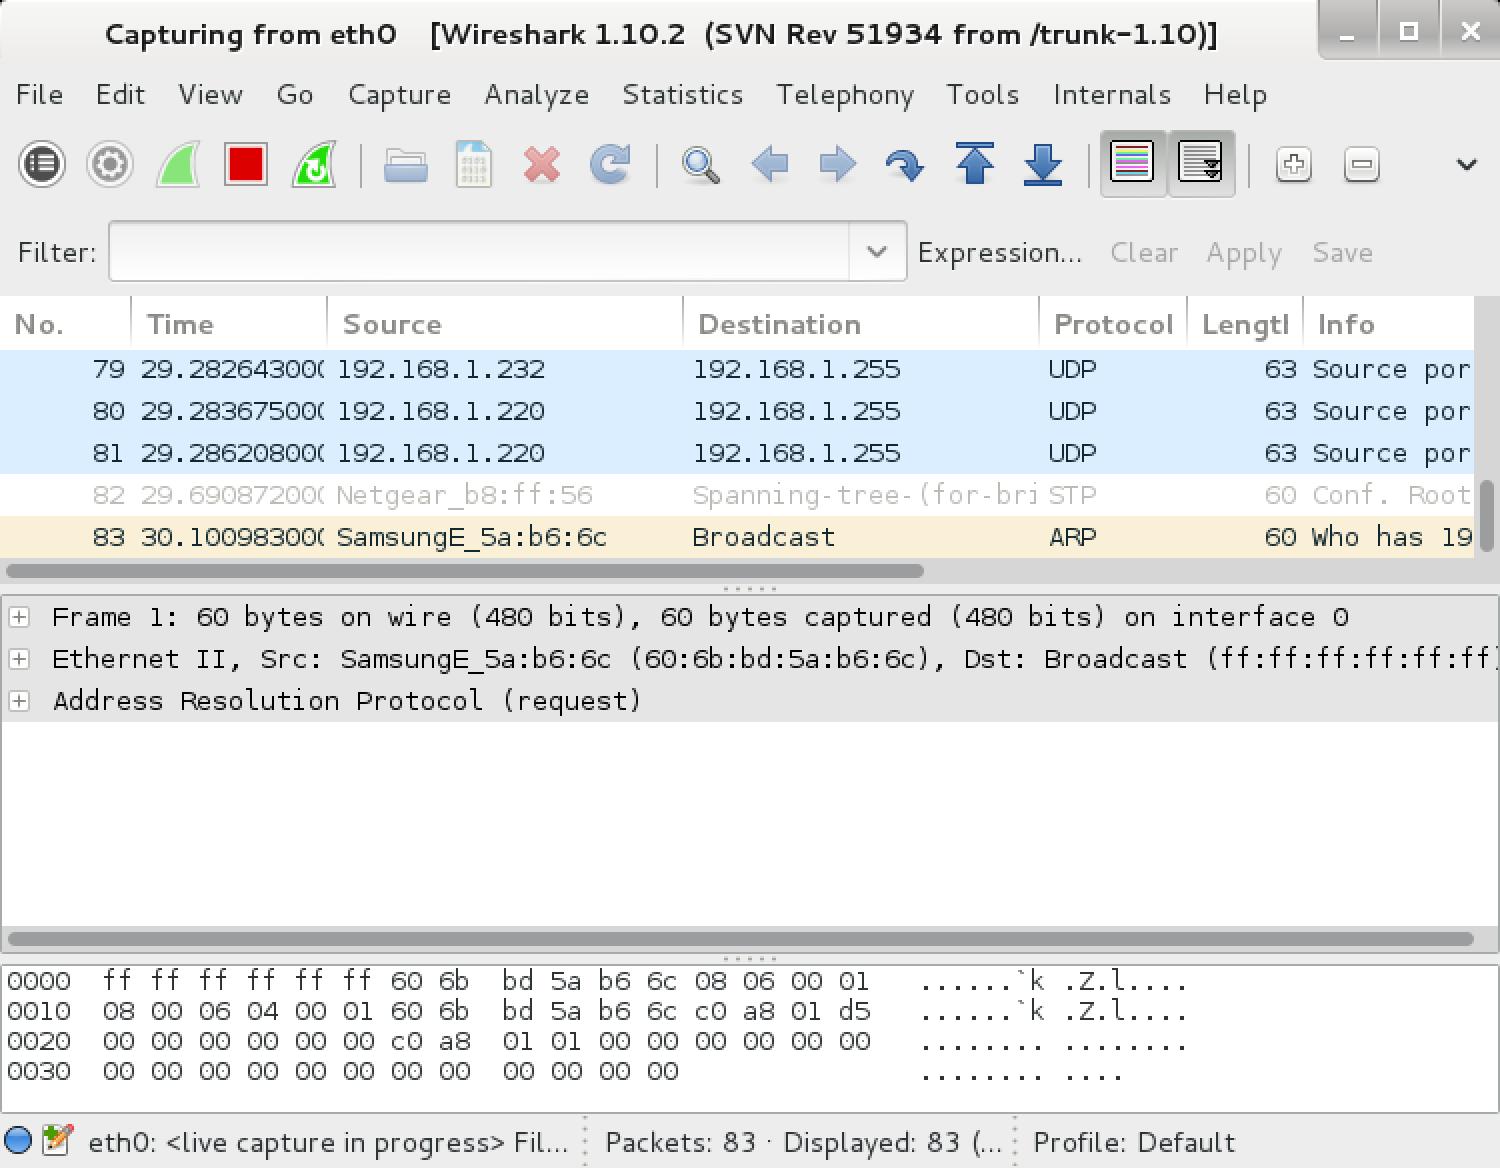
- Standard three-pane packet browser
- Multi-platform: Runs on Windows, Linux, OS X, Solaris, FreeBSD, NetBSD, and many others
- Captured network data can be browsed via a GUI, or via the TTY-mode TShark utility
- The most powerful display filters in the industry
- Rich VoIP analysis
- Capture files compressed with gzip can be decompressed on the fly
- Live data can be read from Ethernet, IEEE 802.11, PPP/HDLC, ATM, Bluetooth, USB, Token Ring, Frame Relay, FDDI, and others (depending on your platform)
- Coloring rules can be applied to the packet list for quick, intuitive analysis
- Output can be exported to XML, PostScript®, CSV, or plain text
- Decryption support for many protocols, including IPsec, ISAKMP, Kerberos, SNMPv3, SSL/TLS, WEP, and WPA/WPA2
- Read/write many different capture file formats: tcpdump (libpcap), Pcap NG, Catapult DCT2000, Cisco Secure IDS iplog, Microsoft Network Monitor, Network * General Sniffer® (compressed and uncompressed), Sniffer® Pro, and NetXray®, Network Instruments Observer, NetScreen snoop, Novell LANalyzer, RADCOM WAN/LAN Analyzer, Shomiti/Finisar Surveyor, Tektronix K12xx, Visual Networks Visual UpTime, WildPackets EtherPeek/TokenPeek/AiroPeek, and many others
Source: http://www.wireshark.org/about.html
Wireshark Homepage | Kali Wireshark Repo
- Author: Gerald Combs and contributors
- License: GPLv2
Tools included in the wireshark package
wireshark – network traffic analyzer – GTK+ version
[email protected]:~# wireshark -h
Wireshark 1.10.2 (SVN Rev 51934 from /trunk-1.10)
Interactively dump and analyze network traffic.
See http://www.wireshark.org for more information.
Copyright 1998-2013 Gerald Combs <[email protected]> and contributors.
This is free software; see the source for copying conditions. There is NO
warranty; not even for MERCHANTABILITY or FITNESS FOR A PARTICULAR PURPOSE.
Usage: wireshark [options] ... [ <infile> ]
Capture interface:
-i <interface> name or idx of interface (def: first non-loopback)
-f <capture filter> packet filter in libpcap filter syntax
-s <snaplen> packet snapshot length (def: 65535)
-p don't capture in promiscuous mode
-k start capturing immediately (def: do nothing)
-S update packet display when new packets are captured
-l turn on automatic scrolling while -S is in use
-I capture in monitor mode, if available
-B <buffer size> size of kernel buffer (def: 2MB)
-y <link type> link layer type (def: first appropriate)
-D print list of interfaces and exit
-L print list of link-layer types of iface and exit
Capture stop conditions:
-c <packet count> stop after n packets (def: infinite)
-a <autostop cond.> ... duration:NUM - stop after NUM seconds
filesize:NUM - stop this file after NUM KB
files:NUM - stop after NUM files
Capture output:
-b <ringbuffer opt.> ... duration:NUM - switch to next file after NUM secs
filesize:NUM - switch to next file after NUM KB
files:NUM - ringbuffer: replace after NUM files
Input file:
-r <infile> set the filename to read from (no pipes or stdin!)
Processing:
-R <read filter> packet filter in Wireshark display filter syntax
-n disable all name resolutions (def: all enabled)
-N <name resolve flags> enable specific name resolution(s): "mntC"
User interface:
-C <config profile> start with specified configuration profile
-Y <display filter> start with the given display filter
-g <packet number> go to specified packet number after "-r"
-J <jump filter> jump to the first packet matching the (display)
filter
-j search backwards for a matching packet after "-J"
-m <font> set the font name used for most text
-t a|ad|d|dd|e|r|u|ud output format of time stamps (def: r: rel. to first)
-u s|hms output format of seconds (def: s: seconds)
-X <key>:<value> eXtension options, see man page for details
-z <statistics> show various statistics, see man page for details
Output:
-w <outfile|-> set the output filename (or '-' for stdout)
Miscellaneous:
-h display this help and exit
-v display version info and exit
-P <key>:<path> persconf:path - personal configuration files
persdata:path - personal data files
-o <name>:<value> ... override preference or recent setting
-K <keytab> keytab file to use for kerberos decryption
--display=DISPLAY X display to use
tshark – network traffic analyzer – console version
[email protected]:~# tshark -h
TShark 1.10.2 (SVN Rev 51934 from /trunk-1.10)
Dump and analyze network traffic.
See http://www.wireshark.org for more information.
Copyright 1998-2013 Gerald Combs <[email protected]> and contributors.
This is free software; see the source for copying conditions. There is NO
warranty; not even for MERCHANTABILITY or FITNESS FOR A PARTICULAR PURPOSE.
Usage: tshark [options] ...
Capture interface:
-i <interface> name or idx of interface (def: first non-loopback)
-f <capture filter> packet filter in libpcap filter syntax
-s <snaplen> packet snapshot length (def: 65535)
-p don't capture in promiscuous mode
-I capture in monitor mode, if available
-B <buffer size> size of kernel buffer (def: 2MB)
-y <link type> link layer type (def: first appropriate)
-D print list of interfaces and exit
-L print list of link-layer types of iface and exit
Capture stop conditions:
-c <packet count> stop after n packets (def: infinite)
-a <autostop cond.> ... duration:NUM - stop after NUM seconds
filesize:NUM - stop this file after NUM KB
files:NUM - stop after NUM files
Capture output:
-b <ringbuffer opt.> ... duration:NUM - switch to next file after NUM secs
filesize:NUM - switch to next file after NUM KB
files:NUM - ringbuffer: replace after NUM files
Input file:
-r <infile> set the filename to read from (no pipes or stdin!)
Processing:
-2 perform a two-pass analysis
-R <read filter> packet Read filter in Wireshark display filter syntax
-Y <display filter> packet displaY filter in Wireshark display filter syntax
-n disable all name resolutions (def: all enabled)
-N <name resolve flags> enable specific name resolution(s): "mntC"
-d <layer_type>==<selector>,<decode_as_protocol> ...
"Decode As", see the man page for details
Example: tcp.port==8888,http
-H <hosts file> read a list of entries from a hosts file, which will
then be written to a capture file. (Implies -W n)
Output:
-w <outfile|-> write packets to a pcap-format file named "outfile"
(or to the standard output for "-")
-C <config profile> start with specified configuration profile
-F <output file type> set the output file type, default is pcapng
an empty "-F" option will list the file types
-V add output of packet tree (Packet Details)
-O <protocols> Only show packet details of these protocols, comma
separated
-P print packet summary even when writing to a file
-S <separator> the line separator to print between packets
-x add output of hex and ASCII dump (Packet Bytes)
-T pdml|ps|psml|text|fields
format of text output (def: text)
-e <field> field to print if -Tfields selected (e.g. tcp.port, col.Info);
this option can be repeated to print multiple fields
-E<fieldsoption>=<value> set options for output when -Tfields selected:
header=y|n switch headers on and off
separator=/t|/s|<char> select tab, space, printable character as separator
occurrence=f|l|a print first, last or all occurrences of each field
aggregator=,|/s|<char> select comma, space, printable character as
aggregator
quote=d|s|n select double, single, no quotes for values
-t a|ad|d|dd|e|r|u|ud output format of time stamps (def: r: rel. to first)
-u s|hms output format of seconds (def: s: seconds)
-l flush standard output after each packet
-q be more quiet on stdout (e.g. when using statistics)
-Q only log true errors to stderr (quieter than -q)
-g enable group read access on the output file(s)
-W n Save extra information in the file, if supported.
n = write network address resolution information
-X <key>:<value> eXtension options, see the man page for details
-z <statistics> various statistics, see the man page for details
Miscellaneous:
-h display this help and exit
-v display version info and exit
-o <name>:<value> ... override preference setting
-K <keytab> keytab file to use for kerberos decryption
-G [report] dump one of several available reports and exit
default report="fields"
use "-G ?" for more help
tshark Usage Example
[email protected]:~# tshark -f "tcp port 80" -i eth0
wireshark Usage Example
[email protected]:~# wireshark
Wireshark 1.10.2 (SVN Rev 51934 from /trunk-1.10)
Interactively dump and analyze network traffic.
See http://www.wireshark.org for more information.
Copyright 1998-2013 Gerald Combs <[email protected]> and contributors.
This is free software; see the source for copying conditions. There is NO
warranty; not even for MERCHANTABILITY or FITNESS FOR A PARTICULAR PURPOSE.
Usage: wireshark [options] ... [ <infile> ]
Capture interface:
-i <interface> name or idx of interface (def: first non-loopback)
-f <capture filter> packet filter in libpcap filter syntax
-s <snaplen> packet snapshot length (def: 65535)
-p don't capture in promiscuous mode
-k start capturing immediately (def: do nothing)
-S update packet display when new packets are captured
-l turn on automatic scrolling while -S is in use
-I capture in monitor mode, if available
-B <buffer size> size of kernel buffer (def: 2MB)
-y <link type> link layer type (def: first appropriate)
-D print list of interfaces and exit
-L print list of link-layer types of iface and exit
Capture stop conditions:
-c <packet count> stop after n packets (def: infinite)
-a <autostop cond.> ... duration:NUM - stop after NUM seconds
filesize:NUM - stop this file after NUM KB
files:NUM - stop after NUM files
Capture output:
-b <ringbuffer opt.> ... duration:NUM - switch to next file after NUM secs
filesize:NUM - switch to next file after NUM KB
files:NUM - ringbuffer: replace after NUM files
Input file:
-r <infile> set the filename to read from (no pipes or stdin!)
Processing:
-R <read filter> packet filter in Wireshark display filter syntax
-n disable all name resolutions (def: all enabled)
-N <name resolve flags> enable specific name resolution(s): "mntC"
User interface:
-C <config profile> start with specified configuration profile
-Y <display filter> start with the given display filter
-g <packet number> go to specified packet number after "-r"
-J <jump filter> jump to the first packet matching the (display)
filter
-j search backwards for a matching packet after "-J"
-m <font> set the font name used for most text
-t a|ad|d|dd|e|r|u|ud output format of time stamps (def: r: rel. to first)
-u s|hms output format of seconds (def: s: seconds)
-X <key>:<value> eXtension options, see man page for details
-z <statistics> show various statistics, see man page for details
Output:
-w <outfile|-> set the output filename (or '-' for stdout)
Miscellaneous:
-h display this help and exit
-v display version info and exit
-P <key>:<path> persconf:path - personal configuration files
persdata:path - personal data files
-o <name>:<value> ... override preference or recent setting
-K <keytab> keytab file to use for kerberos decryption
--display=DISPLAY X display to use
TShark 1.10.2 (SVN Rev 51934 from /trunk-1.10)
Dump and analyze network traffic.
See http://www.wireshark.org for more information.
Copyright 1998-2013 Gerald Combs <[email protected]> and contributors.
This is free software; see the source for copying conditions. There is NO
warranty; not even for MERCHANTABILITY or FITNESS FOR A PARTICULAR PURPOSE.
Usage: tshark [options] ...
Capture interface:
-i <interface> name or idx of interface (def: first non-loopback)
-f <capture filter> packet filter in libpcap filter syntax
-s <snaplen> packet snapshot length (def: 65535)
-p don't capture in promiscuous mode
-I capture in monitor mode, if available
-B <buffer size> size of kernel buffer (def: 2MB)
-y <link type> link layer type (def: first appropriate)
-D print list of interfaces and exit
-L print list of link-layer types of iface and exit
Capture stop conditions:
-c <packet count> stop after n packets (def: infinite)
-a <autostop cond.> ... duration:NUM - stop after NUM seconds
filesize:NUM - stop this file after NUM KB
files:NUM - stop after NUM files
Capture output:
-b <ringbuffer opt.> ... duration:NUM - switch to next file after NUM secs
filesize:NUM - switch to next file after NUM KB
files:NUM - ringbuffer: replace after NUM files
Input file:
-r <infile> set the filename to read from (no pipes or stdin!)
Processing:
-2 perform a two-pass analysis
-R <read filter> packet Read filter in Wireshark display filter syntax
-Y <display filter> packet displaY filter in Wireshark display filter syntax
-n disable all name resolutions (def: all enabled)
-N <name resolve flags> enable specific name resolution(s): "mntC"
-d <layer_type>==<selector>,<decode_as_protocol> ...
"Decode As", see the man page for details
Example: tcp.port==8888,http
-H <hosts file> read a list of entries from a hosts file, which will
then be written to a capture file. (Implies -W n)
Output:
-w <outfile|-> write packets to a pcap-format file named "outfile"
(or to the standard output for "-")
-C <config profile> start with specified configuration profile
-F <output file type> set the output file type, default is pcapng
an empty "-F" option will list the file types
-V add output of packet tree (Packet Details)
-O <protocols> Only show packet details of these protocols, comma
separated
-P print packet summary even when writing to a file
-S <separator> the line separator to print between packets
-x add output of hex and ASCII dump (Packet Bytes)
-T pdml|ps|psml|text|fields
format of text output (def: text)
-e <field> field to print if -Tfields selected (e.g. tcp.port, col.Info);
this option can be repeated to print multiple fields
-E<fieldsoption>=<value> set options for output when -Tfields selected:
header=y|n switch headers on and off
separator=/t|/s|<char> select tab, space, printable character as separator
occurrence=f|l|a print first, last or all occurrences of each field
aggregator=,|/s|<char> select comma, space, printable character as
aggregator
quote=d|s|n select double, single, no quotes for values
-t a|ad|d|dd|e|r|u|ud output format of time stamps (def: r: rel. to first)
-u s|hms output format of seconds (def: s: seconds)
-l flush standard output after each packet
-q be more quiet on stdout (e.g. when using statistics)
-Q only log true errors to stderr (quieter than -q)
-g enable group read access on the output file(s)
-W n Save extra information in the file, if supported.
n = write network address resolution information
-X <key>:<value> eXtension options, see the man page for details
-z <statistics> various statistics, see the man page for details
Miscellaneous:
-h display this help and exit
-v display version info and exit
-o <name>:<value> ... override preference setting
-K <keytab> keytab file to use for kerberos decryption
-G [report] dump one of several available reports and exit
default report="fields"
use "-G ?" for more help